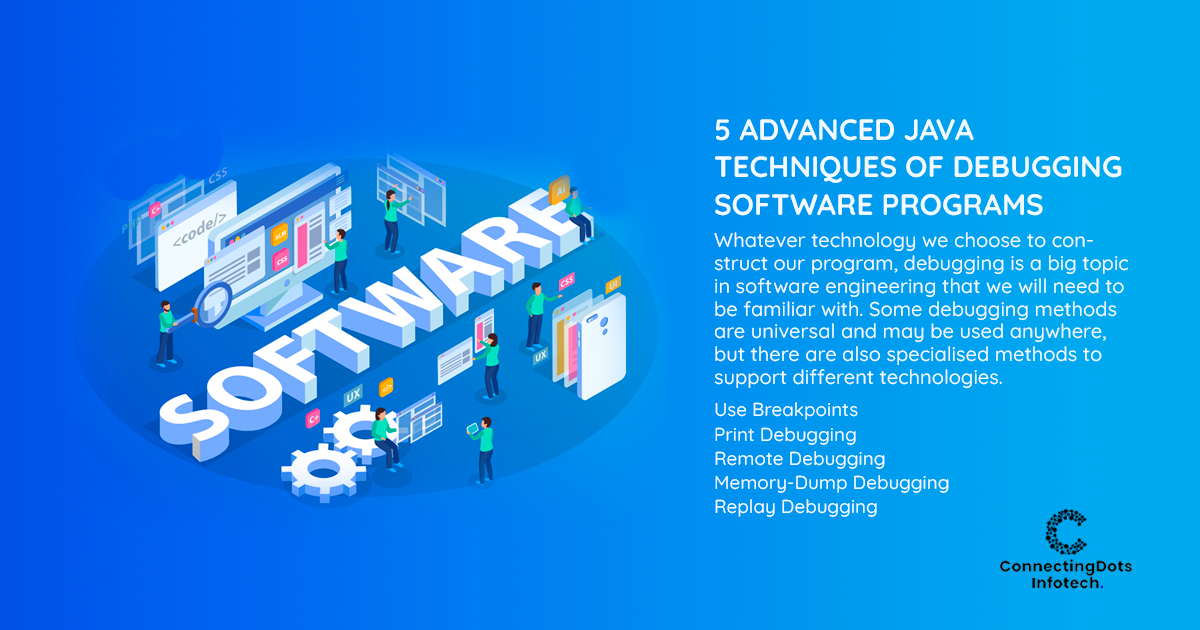
5 Advanced Java Techniques Of Debugging Software Programs
Whatever technology we choose to construct our program, debugging is a big topic in software engineering that we will need to be familiar with. Some debugging methods are universal and may be used anywhere, but there are also specialised methods to support different technologies. This article will discuss several Java debugging techniques that all Java developers should be aware of in order to create top-notch solutions.
#1. Use Breakpoints
A breakpoint is a line of code that is purposefully included with the goal of pausing or stopping program execution at that particular place. The breakpoint invokes the debugger or causes a CPU-level interruption while the program is running. The application switches to exceptional handling mode as a result.
Advanced Java programmers can accomplish this task by using either conditional breakpoints or exception breakpoints.
Here is a brief rundown of what they provide:
- Because they may be used to remove defects from the program conditionally, conditional breakpoints are better suited for the Eclipse IDE. Developers can add a condition to a breakpoint, and if that condition is met, the breakpoint state will change from false to true. The thread will halt or end at the breakpoint as a result of this change in state.
- On the other hand, with the Eclipse and Netbeans IDE, exception breakpoints are usually utilised to resolve NullPointerException or ArrayIndexOutofBoundException issues. When a designed exception occurs, the debugger will search through the program and stop it from running. These are frequently used to stop significant errors.
You have watchpoints, which are effectively breakpoints put on a variable or field, in addition to these breakpoints. The program execution will pause each time the problematic variable or field is accessed or changed, allowing you to troubleshoot.
The conditional, validation, and control methods may be implemented differently by different debuggers employing Advanced Java techniques, making them very flexible versus business needs. For instance, some debuggers may totally stop the application, whilst others could manipulate data to restart executions. In any case, it gives the Advanced Java developer complete control over the course of events.
#2. Print Debugging
Have you ever encountered a problem where the program displays trash values on the screen when debugging? Then you have a basic understanding of what print debugging implies. During program execution, this popular Advanced Java debugging approach writes random numbers and shows them at the console or user interface. Developers frequently use it to understand the logic or data transfer occurring in the background as well as the flow within the function or service. The inclusion of the print statements in the code depends on the developer's assessment of the location of the issue and is based on pure assumptions instead of logic.
It is frequently used to avoid any small flaws, such as issues with the application's flow or difficult-to-identify code blocks that are the source of the defect, despite the fact that it is not among the most dependable techniques for advanced Java debugging.
#3. Remote Debugging
This advanced Java debugging approach, as its name suggests, uses a remote connection and does not require the debugger and the program to be running on the same platform or server. Given their complementing nature, such Advanced Java debugging techniques are frequently used in conjunction with production debugging.
The resources needed are modest when we develop software applications for one or a small number of devices. Due to this restriction, the design is such that the code for executing the program and the code for debugging are incompatible. Remote debugging enters the scene at this point.
Do not, however, assume that large-scale applications cannot benefit from remote debugging because many of these solutions feature distributed architectures, which can help to preserve the modularity, flexibility, and adaptability that non-monolithic systems enjoy. Additionally, programmers may construct remote debuggers for certain activities like debugging particular microservices.
All that has to be taken into consideration is how to connect the operating system and business application using programmable hooks that start the debugging process automatically. Any debugger may be converted into a remote debugger once such a connection has been made.
#4. Memory-Dump Debugging
When an application breaks, a memory dump is a snapshot of the memory and related data. Imagine it as a black box inside of an aircraft. From this memory dump, developers may recover the "stack trace" to understand precisely when, when, what, and how the program failed. The values of local and global variables, as well as other crucial information at the time of the crash, would be logged in the stack trace. The next step is to trace the reasons that led to the outcomes in order to reverse-engineer them.
However, developers don't need to wait for a crash to do memory dump debugging. In these situations, they would concentrate on the faults that make a function or a process behave erratically, imitating a "micro-crash."
If you run many Java apps that communicate with one another, this advanced Java debugging approach may prove to be quite helpful. Determine which program is causing the issue and fix it using memory-dump debugging.
#5. Replay Debugging
Replay debugging jumps immediately into reverse engineering, whereas memory dump debugging just somewhat does. Developers may examine apps that have a clear path from point A to point B using this type of advanced Java debugging approach. The developer may then track the bug to the main problem by using this approach as a guide!
Developers must capture the whole process of a program's execution in order to use the Advanced Java Replay Debugging features. All data exchanges, data updates, user inputs, events, memory management, and output displays that would typically occur throughout the course of events would be replicated at this stage.
The developer should ideally test every possible software execution scenario, particularly those involving system failures and disruptions. Once a tape of this walkthrough has been made, they may play it back step-by-step to determine what went wrong throughout the execution. The replay debugging method provides a comprehensive and connected picture of the entire procedure.
Conclusion
Java debugging doesn't have to be difficult. Any of these debugging tools will speed up the debugging procedure significantly. Although every use case will be unique, weighing your options will enable you to select the best tool for your project.